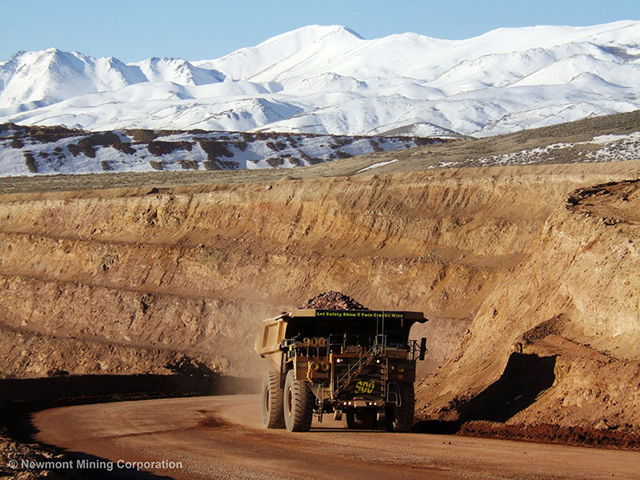
Image: Twin Creeks Mine - Nevada
Investment Thesis
Newmont Mining (NEM) is one of the largest gold producers in the world, with quality assets and a unique project pipeline. I recommend the stock as a long-term investment.
As we all know, owning gold works well as a hedge against inflation/US dollar, and it is the traditional rationale behind why I am keeping a constant gold holding including stable gold miners. However, while this belief is true at least for the long-term, it is highly debatable for the short and midterm.
I always have allocated between 8% to 10% of my total portfolio to precious metals - Gold, Platinum, and Palladium mainly - for this exact purpose and it has been rewarding. The practical question is to select suitable gold stocks with limited risks that can be proved a viable proxy for gold and present a long-term growth potential.
Gary J. Goldberg, the CEO, said in the conference call:
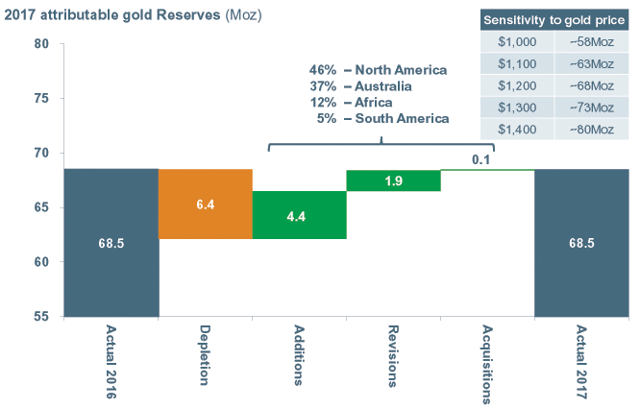
We also strengthened our global portfolio of long-life assets by delivering the Tanami Expansion safely on-time and on-budget, advancing five projects that will add profitable production, outperforming our exploration targets replacing reserves depletion of 6.4 million ounces and growing our resource base, and securing early-stage exploration options in Canada, French Guiana, and across the Andes. Finally, we drove toward our goal of leading the gold sector in both profitability and responsibility by improving free cash flow by 88% to $1.5 billion
Thus, investing in the gold majors such as Newmont Mining makes sense, as long as the balance sheet is showing a bright horizon ahead.
It is by any means a guarantee of complete success for investors, and to profit, I believe it is imperative to apply the right strategy by combining a long-term investment goal supported by technical trading. This market is highly dynamic especially the gold sector that necessitates an active involvement.
Balance Sheet and Production in 4Q'2017. The raw numbers.
| Newmont Mining | 1Q'15 | 2Q'15 | 3Q'15 | 4Q'15 | 1Q'16 | 2Q'16 | 3Q'16 | 4Q'16 | 1Q'17 | 2Q'17 | 3Q'17 | 4Q'17 |
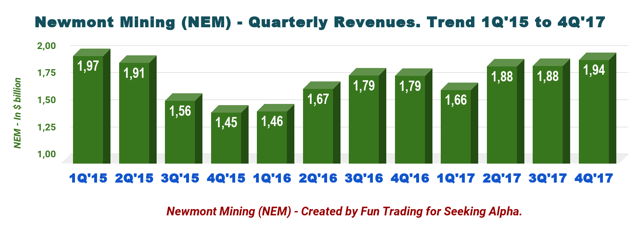
| Total Revenues in $ Billion | 1.97 | 1.91 | 1.56 | 1.45 | 1.46 | 1.67 | 1.79 | 1.79 | 1.66 | 1.88 | 1.88 | 1.94 |
| Net Income in $ Million | 183 | 72 | 219 | −254 | 52 | 23 | −358 | −344 | 46 | 177 | 206 | −527 |
| EBITDA $ Million | 786 | 679 | 462 | 190 | 480 | 587 | 626 | −396 | 579 | 677 | 649 | 694 |
| Profit margin % (0 if loss) | 9.3% | 3.8% | 14.0% | 0 | 3.6% | 1.4% | 0 | 0 | 2.8% | 9.4% | 11.0% | 0 |
| EPS diluted in $/share | 0.37 | 0.14 | 0.42 | −0.50 | 0.10 | 0.04 | −0.67 | −0.65 | 0.09 | 0.33 | 0.38 | −0.98 |
| Cash from operations in $ Million | 625 | 438 | 810 | 272 | 526 | 777 | 850 | 633 | 373 | 526 | 685 | 751 |
| Capital Expenditure in $ Million | 284 | 322 | 283 | 422 | 280 | 283 | 269 | 301 | 180 | 183 | 194 | 309 |
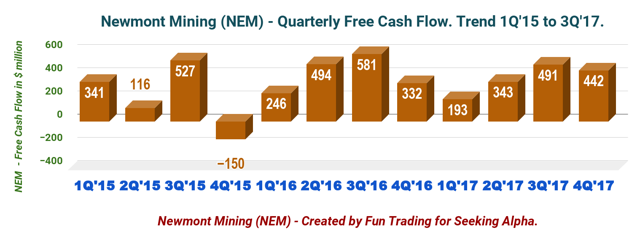
| Free Cash Flow (Ychart) in $ Million | 341 | 116 | 527 | −150 | 246 | 494 | 581 | 332 | 193 | 343 | 491 | 442 |
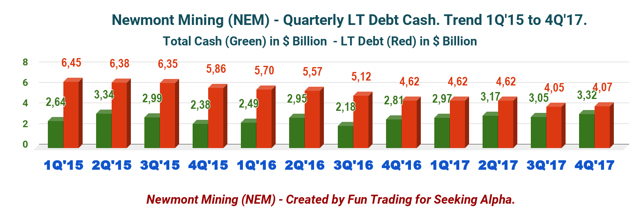
| Cash and short term investments $ Billion | 2.64 | 3.34 | 2.99 | 2.38 | 2.49 | 2.95 | 2.18 | 2.81 | 2.97 | 3.17 | 3.05 | 3.32 |
| Long term Debt in $ Billion | 6.45 | 6.38 | 6.35 | 5.86 | 5.70 | 5.57 | 5.12 | 4.62 | 4.62 | 4.62 | 4.05 | 4.07 |
| Dividend per share in $ | 0.025 | 0.025 | 0.025 | 0.025 | 0.025 | 0.025 | 0.025 | 0.05 | 0.05 | 0.05 | 0.075 | 0.14 |
| Shares outstanding (diluted) in Million | 500 | 506 | 530 | 531 | 531 | 533 | 533 | 532 | 533 | 535 | 542 | 538 |
Source: Company filings and Morningstar.
1 - Gold Production details
AISC has increased this quarter to $968 per ounce due to increased CapEx and increased costs. It is a significant value that will have to be monitored in 2018.
Gold production was 1,341 K Au Oz in 4Q'17 or 1.4% higher than a year ago. Merian and Tanami mines were doing very well and contributed to the increase in gold produced during the fourth quarter.
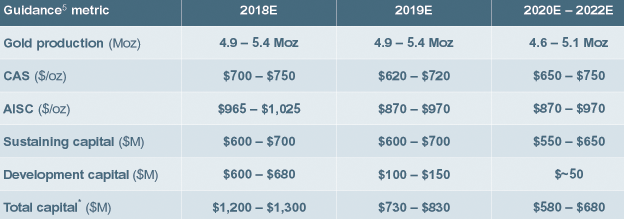
Five years guidance and 2017 Reserves of 68.5 M oz.
Source: NEM Presentation 4Q17.
2 - Newmont Revenues.
Newmont Mining's fourth quarter 2017 results beat consensus on quarterly revenue and beat consensus on adjusted earnings by $0.02 per diluted share. The adjusted net profit was $0.40 per diluted share in the fourth quarter of 2017 or $216 million. It was a 60% increase from a year ago.
The company announced an 8.4% year over year growth on revenue of $1.94 billion. This increase is due primarily to prices for gold and copper significantly higher year-over-year.
3 - Newmont Free Cash Flow.
Free cash flow is an important clue that should always be carefully evaluated when studying a long-term investment. FCF should be sufficient and of course positive if we can consider the business model as viable.
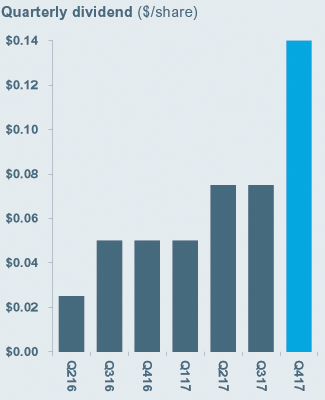
NEM free cash flow is impressive with $1.47 billion on a yearly basis. NEM is a cash machine. It is the main reason why the company decided to increase dividends by 50% to now $0.075 per quarter or $0.30 annually which is still very conservative. Dividend payout after the rise in 4Q'17 is $300 million annually which leaves ample room for more dividend increase in 2018 or either share buybacks or debt reduction.
Source: NEM Presentation.
4 - Newmont Net Debt.
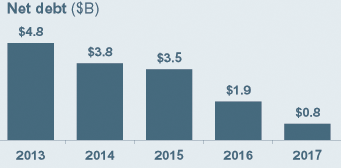
Newmont Mining net debt is now $0.75 billion. With liquidity of $6.2 billion as of December 31, 2017, with a net debt-to-adjusted EBITDA of 0.3x, the company cannot be in better financial shape. NEM repaid $580 million in gross debt in 2017. NEM has no debt maturities due until the fourth quarter of 2019.
Source: NEM Presentation.
Commentary and Technical Analysis.
Newmont Mining is showing a very impressive balance sheet "with $3.3 billion cash on hand, a leverage ratio of 0.3x net debt to adjusted EBITDA, and one of the best credit ratings in the mining sector."
More importantly, the miner is indicating a longer-term production expected to remain stable at between 4.6 and 5.1 million ounces per year through 2022 (excluding development projects which have yet to be approved).
NEM is the perfect long-term profile from an investor's perspective, and I recommend to accumulate the stock on any weakness.
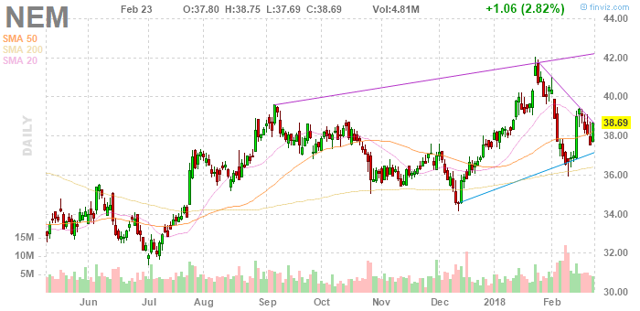
NEM is showing an ascending wedge pattern or rising wedge. An ascending wedge is a bullish chart pattern used in technical analysis that is easily recognizable by the right triangle created by two trendlines (resistance and support).
The trendline support for NEM is approximately $37.25 (buy flag) and assuming that the support holds, I expect NEM to re-test $42 if gold price can hold above $1,300 per ounce. NEM is strongly correlated to the gold price, and both gold price and fundamental should be factored into your trading strategy.
An intermediate resistance at $40 may be on the way (partial sell flag). The downside is pretty limited unless a sharp correction in gold price which is always possible. However, if the stock breaks out on the downside, it may re-test $32 (double bottom).
Disclosure: I am/we are long NEM.
I wrote this article myself, and it expresses my own opinions. I am not receiving compensation for it (other than from Seeking Alpha). I have no business relationship with any company whose stock is mentioned in this article.
Additional disclosure: I also trade NEM.


0 Response to "Newmont Mining: Impressive Free Cash Flow - Seeking Alpha - Seeking Alpha"
Post a Comment